

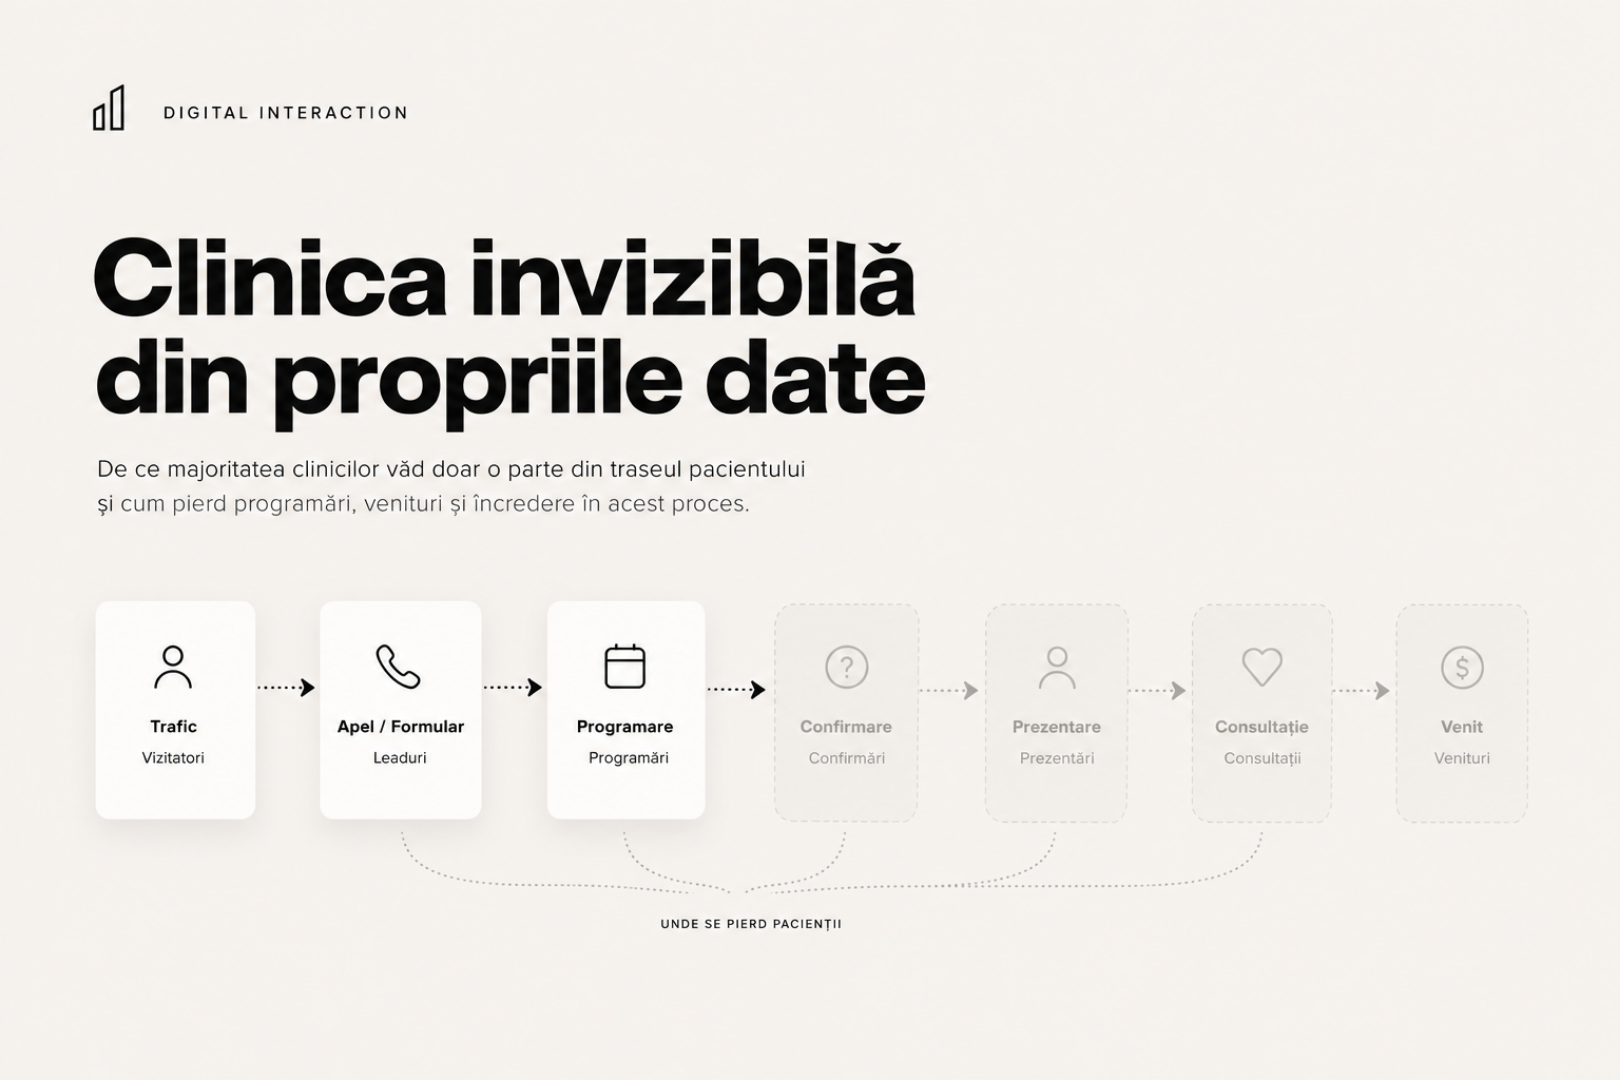
If your marketing report ends with the number of leads and appointments generated, there is probably a significant part of your clinic that you cannot see.
Someone calls and nobody answers.
Another person submits a form but is contacted too late.
Someone calls twice and also submits a form, while your system records three separate leads.
A patient books but never shows up.
Another attends the consultation, receives a treatment recommendation and never moves forward.
All of these things happen inside the clinic whether they appear in your dashboard or not.
We call this the invisible clinic: the part of the business producing valuable information every day, but which management cannot see clearly enough to make informed decisions.
And the problem is not simply that many clinics do not measure their data.
The bigger problem is that even among the clinics that start measuring, relatively few manage to do it accurately and consistently over time.
See how much of the patient journey you can actually measure today.
The real clinic funnel is not “ad → lead → patient”
Many marketing reports reduce the process to something like this:
Ad → Lead → Appointment
It is easy to understand.
It is easy to report.
And it is incomplete.
The real patient journey looks more like:
Visit → Call or form → Contact → Conversation → Qualification → Appointment → Confirmation → Attendance → Consultation → Treatment → Retention
See how our Conversion Architecture works.
There is a conversion rate between every two stages.
And there is an opportunity to lose a patient between every two stages.
Suppose a campaign generates 100 enquiries in one month.
If you report only those 100 leads, the campaign may look successful.
But what if:
- 18 calls were never answered;
- 12 people were contacted too late;
- 15 never booked;
- 10 booked but did not attend;
- 8 attended but never started treatment?
The problem can no longer be understood from a report that simply says:
100 leads generated.
This is why Measurement sits underneath the entire system in our Conversion Architecture.
It is not something you add after the campaign has launched.
Without measurement, you cannot confidently tell whether you need to change the ads, the website, reception, the booking process, the offer or retention.
The data many clinics never see
You do not need to turn your clinic into a data science department.
But there are several pieces of information that can completely change how you interpret marketing performance.
Missed calls
If the phone rings and nobody answers, Google Ads may still record that interaction as a conversion.
For the clinic, however, it may never become a patient.
So the useful question is not simply:
How many calls did we receive?
It is:
- How many were answered?
- How many were missed?
- How many missed calls were recovered?
- When do most missed calls happen?
- Which channels are generating them?
Not sure how many patients you lose after the first enquiry? We can identify where the journey breaks down.
Speed to first response
Two leads that look identical in a marketing report may have completely different experiences.
The first submits a form at 10:15 and receives a call at 10:20.
The second submits the same form at 10:15 and gets contacted the following day.
Your report shows two leads.
In reality, they are not two equal opportunities.
If you do not measure response time, you can easily blame marketing for a problem that actually occurs after the lead has already been generated.
Duplicate leads
A patient might:
see an ad;
call the clinic;
return to the website;
submit a form;
call again two days later.
A weak tracking setup may record these interactions as separate leads.
The result?
Your cost per lead looks lower than it really is.
Marketing appears more efficient.
Lead volume appears higher.
But the number of actual people interested in your services has not changed.
Deduplication is therefore not just a technical detail.
It is necessary if you want to trust the numbers you are using.
Why people do not book
Some of the most valuable data inside a clinic sits with reception.
Patients tell you why they do not move forward.
It may be:
- price;
- no suitable appointment availability;
- location;
- their preferred doctor being unavailable;
- wanting only an estimate;
- comparing several clinics;
- a service not being available;
- no longer answering follow-up calls.
If all of these outcomes are recorded simply as “lead lost”, you lose the information that could actually improve the business.
There is a major difference between:
“The campaign is not generating patients.”
and:
“The campaign is generating demand, but 27% of interested patients do not book because the next available appointment is three weeks away.”
The second statement gives you something you can act on.
Appointments that never become attended consultations
A booking is not yet a patient.
If marketing produces 50 appointments but only 35 people attend, you have a very different problem from a clinic where 47 out of 50 show up.
Measurement therefore needs to continue after the booking.
At minimum, you should be able to distinguish:
Lead → Appointment → Attended appointment
Otherwise, marketing can report success while doctors continue to see empty time slots.
Services that generate interest but not treatment
Sometimes the problem is not a lack of demand.
You may receive a high number of enquiries for a certain procedure but see very few of them turn into treatment.
Without proper measurement, the conclusion may be:
“We need more leads.”
With the right data, the conclusion may become:
“We already have enough demand. The problem is conversion after consultation.”
Those are two completely different problems.
And they require completely different solutions.
The source of the patient, not just the source of the lead
Imagine two marketing channels.
Channel A
- 100 leads
- low cost per lead
- 10 patients
Channel B
- 40 leads
- higher cost per lead
- 16 patients
If you optimise purely around CPL, Channel A may look like the winner.
If you optimise around the cost of acquiring an actual patient, the conclusion may be completely different.
This is one of the biggest problems with conventional marketing reporting:
businesses optimise for what is easiest to measure rather than what matters financially.
Why measurement systems deteriorate over time
Implementing tracking is the easy part.
Making sure it still works correctly three, six or twelve months later is harder.
A measurement system is not something you configure once and forget.
It is a living system.
Your tracking may have worked six months ago. The question is whether it is still accurate today.
Reception already has enough to deal with
The phone is ringing.
A patient is waiting at the desk.
A doctor needs something.
Another patient needs to be rescheduled.
WhatsApp messages are coming in.
In this environment, if your measurement system requires reception to manually complete ten or twelve fields after every interaction, the data will eventually become incomplete.
That does not necessarily mean reception is doing a poor job.
It may simply mean the process was badly designed.
A good system automates whatever can be automated and asks people to enter only the information that technology cannot reliably determine on its own.
As the clinic grows, the doctor has less time
At the beginning, an owner may be able to follow almost everything personally.
They look at the ads.
They ask reception what is happening.
They check appointments.
They speak to the agency.
As patient numbers grow, that becomes increasingly difficult.
If measurement works only because the clinic owner checks the system personally every week, you do not have a process.
You have a dependency.
Integrations can break without anyone noticing
A website form can be changed.
A webhook can stop sending data.
A CRM may continue receiving leads but lose their acquisition source.
UTM parameters can disappear.
Call tracking can be incorrectly configured after another technical change.
An update can alter the behaviour of an integration.
The dangerous part is that everything may continue to look normal.
The dashboard loads.
The graphs are still there.
Numbers continue changing.
But the information behind them is no longer complete.
The most dangerous tracking system is not the one that does not exist. It is the one you believe is working correctly.
Incorrect data can be more dangerous than having no data at all
Imagine the following.
In January, reception correctly classifies 95% of enquiries.
In February, that falls to 80%.
By March, only half of your leads have a complete status.
Your dashboard continues comparing all three months.
The graph still shows a trend.
But those months are no longer directly comparable.
You no longer have a pure performance problem.
You have a data integrity problem.
If nobody identifies it, the clinic may start making real business decisions based on a distorted picture.
You might:
- stop a profitable campaign;
- increase budget on a weak campaign;
- replace your agency;
- change your offer;
- assume reception is converting worse;
- conclude that demand for a service has fallen.
Meanwhile, the real problem may simply be a broken integration or an internal field that is no longer being completed.
A polished dashboard does not guarantee accurate data.
Do not measure everything. Measure what can change a decision
The opposite mistake is trying to collect everything.
Dozens of fields.
Dozens of KPIs.
Dashboards nobody actually uses.
That is not the objective.
A simple rule is:
If a metric cannot influence a decision, there should be a very good reason for collecting it.
For most clinics, the relevant data can be grouped into five areas.
1. Acquisition
You should know:
- where the enquiry came from;
- which campaign generated it;
- which service the person was interested in;
- how much it cost to generate the enquiry.
2. Contact and reception
You should know:
- whether the person was successfully contacted;
- how quickly;
- how many attempts were required;
- whether the call was missed;
- why the person did not book.
3. Booking
You should be able to monitor:
- lead-to-appointment conversion;
- cancellations;
- rescheduling;
- time between first enquiry and appointment.
4. Attendance and treatment
You should distinguish between:
- appointment booked;
- patient attended;
- service requested;
- treatment recommended;
- treatment started, where your workflow and data governance allow this to be measured appropriately.
5. Financial outcome
Ultimately, marketing has to connect back to the business.
The questions become:
- How much does a new patient cost us?
- Which channels generate actual patients rather than forms?
- Which services generate revenue?
- Where are we losing money?
- Which channels deserve more budget?
This is the difference between reporting and managing with data.
Collecting data without interpreting it creates very little value
You can have excellent tools and still get very little from them.
CRM.
Call tracking.
Google Analytics.
Dashboards.
Automations.
All of them can work perfectly from a technical perspective.
But if nobody regularly looks at the information and asks:
“What decision should we make because of this?”
then data collection becomes a ritual.
Not an advantage.
Imagine discovering that most missed calls happen between 12:00 and 14:00.
That insight has value only if it leads to action.
Maybe you adjust reception coverage.
Maybe you introduce a callback system.
Maybe you route calls differently.
Maybe you discover that you do not need more traffic at all.
You need to handle the demand you already have more effectively.
Data does not optimise the clinic.
The decisions you make because of the data do.
How to tell whether part of your clinic is still invisible
A simple test is to see how quickly you can answer the following questions.
Not approximately.
Not with “I think”.
With numbers.
Can you answer these questions in less than five minutes?
- How many new enquiries did you receive last month?
- How many unique people did those enquiries represent?
- How many calls were missed?
- How many missed calls were recovered?
- What is your average first-response time?
- What percentage of leads become appointments?
- What percentage of booked patients actually attend?
- What are the main reasons people do not book?
- Which source generates the most actual patients?
- What is your cost per new patient by channel?
- Which services generate significant interest but convert poorly?
- Can you verify that your CRM data is complete?
- Would you know quickly if an important integration stopped working today?
If you cannot answer many of these questions, it does not automatically mean your marketing is poor.
It means you do not yet have enough visibility to assess it properly.
That distinction matters.
Measurement should be treated as a process, not an implementation
A healthy measurement system works as a cycle:
Collection → Validation → Interpretation → Decision → Verification
Then the cycle begins again.
Collection
The right data needs to be captured across the important stages of the patient journey.
Validation
You need to verify that what appears in the system reflects what is actually happening inside the clinic.
Interpretation
Numbers need context.
A higher CPL does not automatically mean weaker performance.
More appointments do not automatically mean more patients.
More website traffic does not automatically mean more revenue.
Decision
The information needs to change something.
Budget.
Process.
Reception capacity.
Landing pages.
The offer.
Follow-up.
Verification
After making a change, measure again.
Did it work?
If yes, by how much?
If not, why?
This is why Measurement is one of the five layers of our Conversion Architecture.
You cannot properly optimise Attraction, Capture, Conversion or Retention if you cannot see what is happening between them.
A simple example: when “we need more leads” is the wrong diagnosis
A clinic says:
“We need more leads.”
Marketing is already generating 200 enquiries every month.
At first glance, the solution seems obvious:
increase the budget.
Then you look at the data.
You discover that:
- a percentage of calls are not being answered;
- many form submissions are contacted too late;
- some appointments never show up;
- leads that do not answer are not followed up consistently;
- the same patient is occasionally recorded more than once.
In this situation, generating another 100 leads may simply mean sending more demand into a system that is already leaking.
The correct diagnosis is no longer:
“We need more leads.”
It becomes:
“We need to convert more of the demand we already have.”
That is why we start with the system, not the tactic.
Conclusion
A clinic does not become data-driven because it has Google Analytics, a CRM and a dashboard.
It becomes data-driven when it can trust that the information used to make decisions is:
complete, comparable, relevant and accurate.
Otherwise, the dashboard does not show you the business.
It only shows you the part of the business you managed to measure.
And the part you cannot see may be exactly where you are losing the most patients.
At Digital Interaction, Measurement is one of the five layers of our Conversion Architecture.
We do not measure simply to produce reports.
We measure so we can identify where conversion is being lost, understand why it is happening and determine what needs to change.